

TABLE OF CONTENT
Team Introduction
Objective
Business Problem
Process
Insight and Findings
Recommendation and Conclusion
Dashboard
Introduction
After the Side Hustle Internship 7.0 program, 7 strangers were paired to form the Data-Analysis-Team-5 for the bootcamp phase of the program.
Our first week together was one of scraping, wrangling, analysing, visualizing, off course jumping inti conclusion – oops that came out – and reporting among strangers; they said. You might want to grab your popcorn. The team members are chill so far at least.
After cleaning, modelling, and visualization, we are so excited to show what we came up with.
Objective
The objective of week 1 project was to analyse data from one the world’s top retail sector fast food business, McDonald’s Menu.
To achieve this, we are to analyze the data based on its categories, items and factors like Sugar and Fiber.
Methodology
The data was downloaded from Kaggle website and was shared with the team for collaboration and insights. The data was loaded unto Microsoft’s Power BI for cleaning, modelling, and visualization.
The cleaning and modelling were done on Power BI’s Power Query and Model View, and the visualization was done with the Report View.
Through the processes, we had several meetings and tasks assigned to decide the best approach to adopt for the storytelling for the presented data, McDonald’s Menu.
Business Problem
The business problem was to understand the nutritional value of the menu and categorize them according to their nutrients.
The analysis seeks to understand the average nutrient of each category from the menu, the percentage daily intake of nutrients and other nutritional insights.
The Process
The CSV format of the McDonald’s Menu data was downloaded from Kaggle website (https://www.kaggle.com/datasets/mcdonalds/nutrition-facts). It was imported into Power BI via the ‘Get Data’, then the data was loaded into Power Query for transformation. The data was cleaned by duplicating the table into several tables, which were distinct.
The tables formed the Fact and Dimensions tables.
The clean data was loaded unto Power BI from Power Query.
Under the Model View, relationships were created to model the data.
The Data Analysis Expressions (DAX) function was used to create measures required to develop the visuals. After which, under the Report View, dashboards were created.

Finding & Insights
The following charts presents our findings

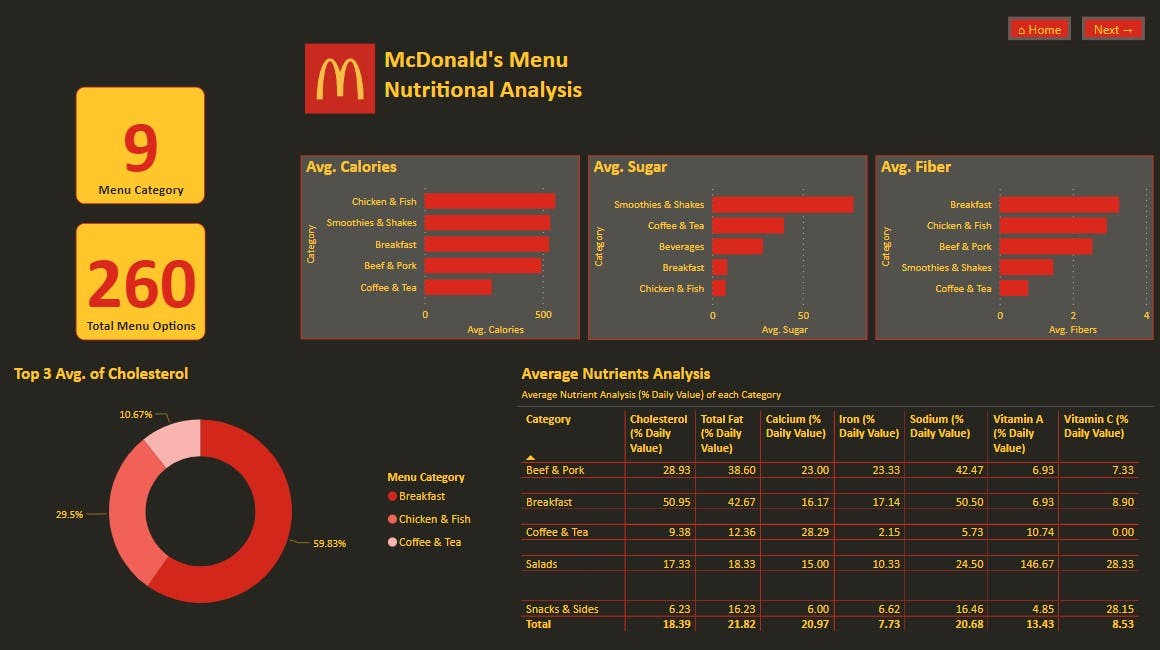
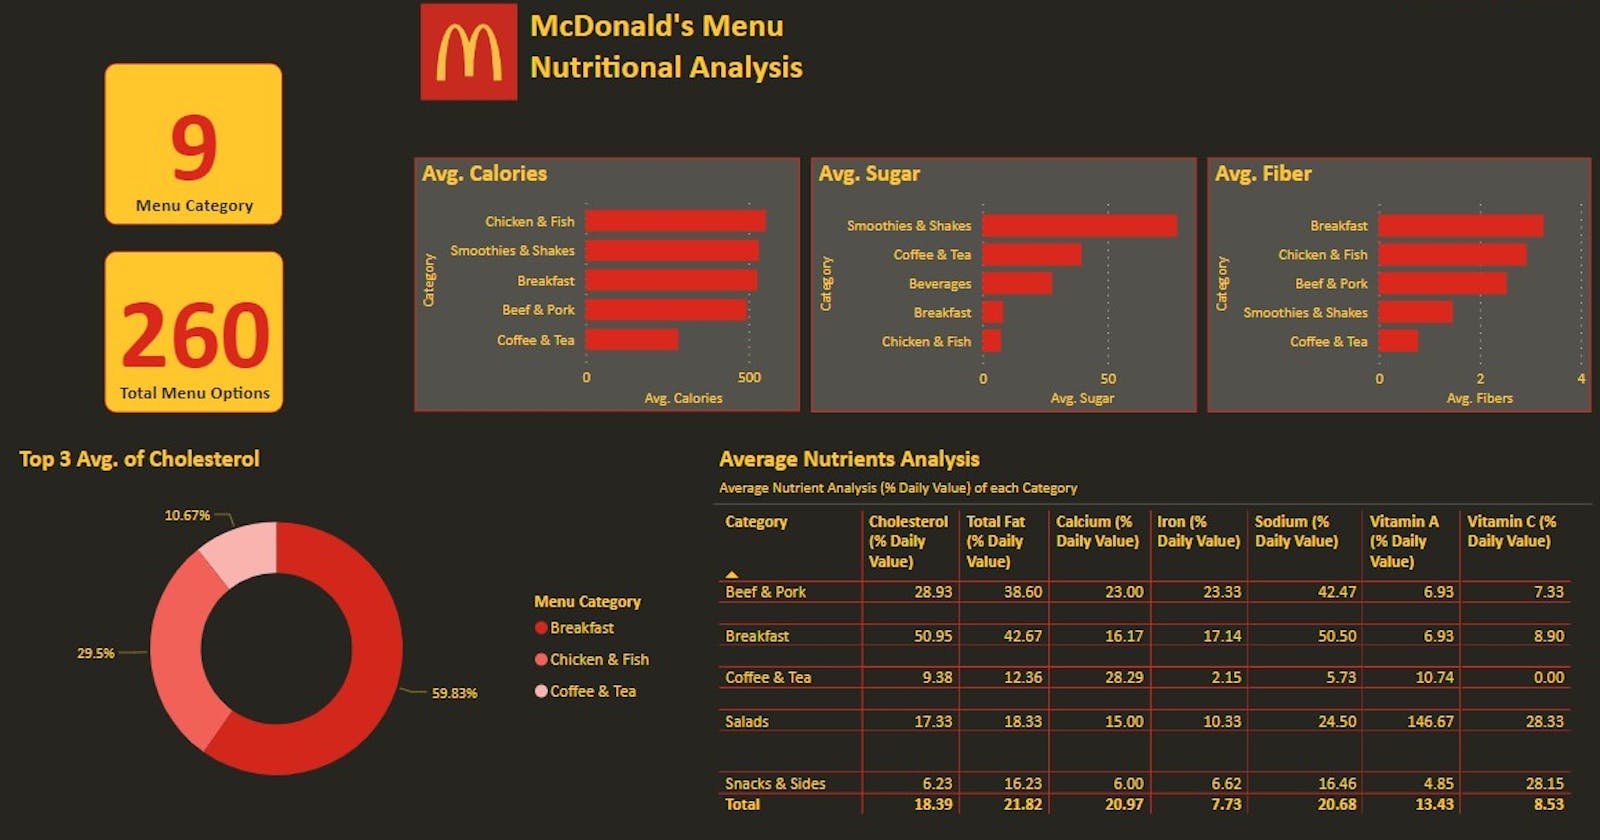
This card shows the total item on the menu to be analyzed
These charts show the average level of Calories, Dietary Fiber, and Sugar for the various categories of the menu items:
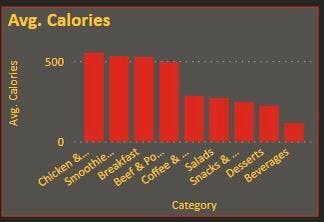
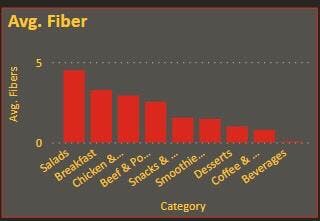
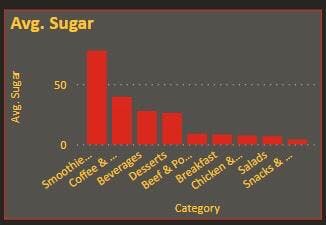
From our findings, Smoothies have the highest sugar content; for Salad, Dietary Fiber; and for Chicken & Fish, Calories.
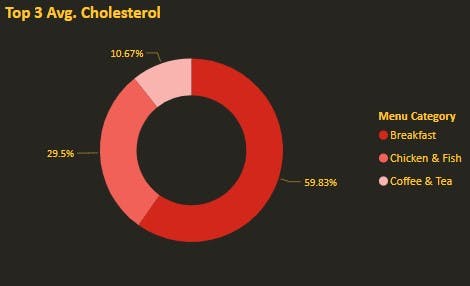
This Donut Chart shows the top 3 cholesterol category with breakfast category having the highest total cholesterol of 59.83%.
Average Daily Nutrients Analysis is represented in the table below. It is showing the average percentage daily value for each category:
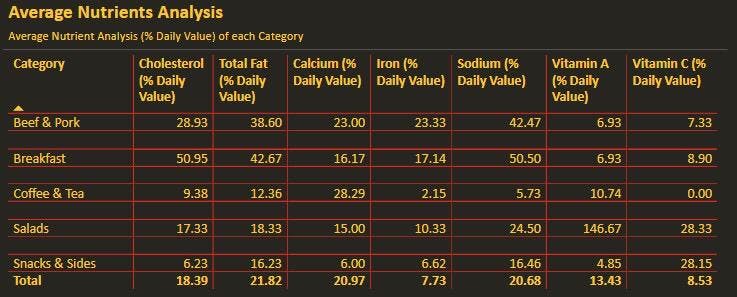
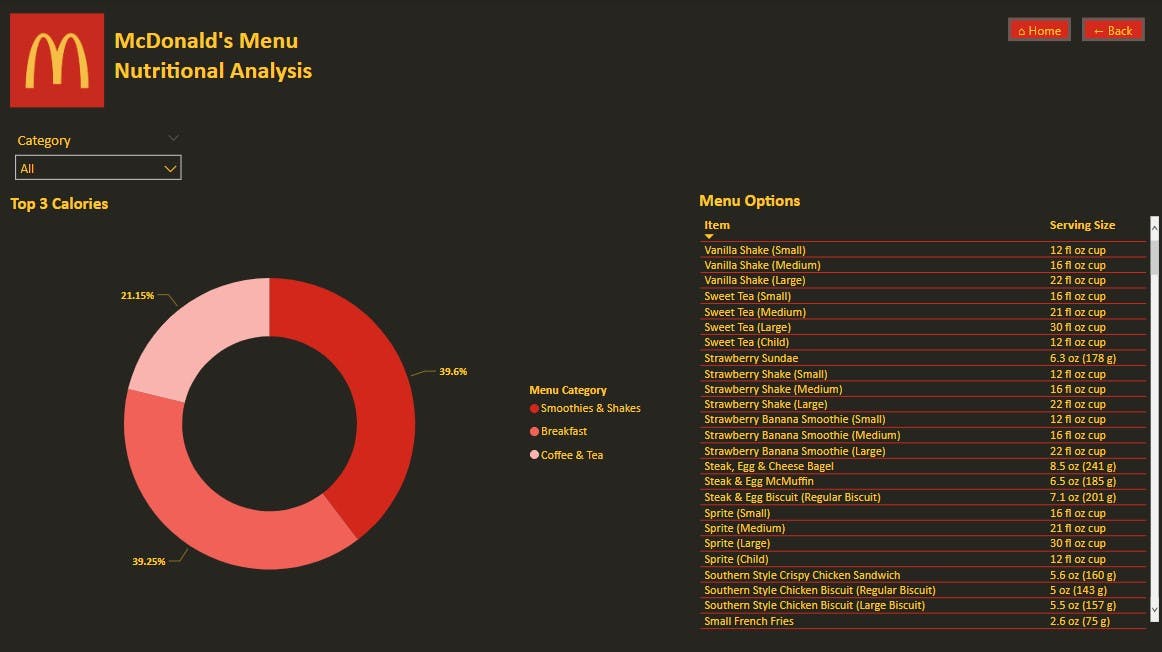
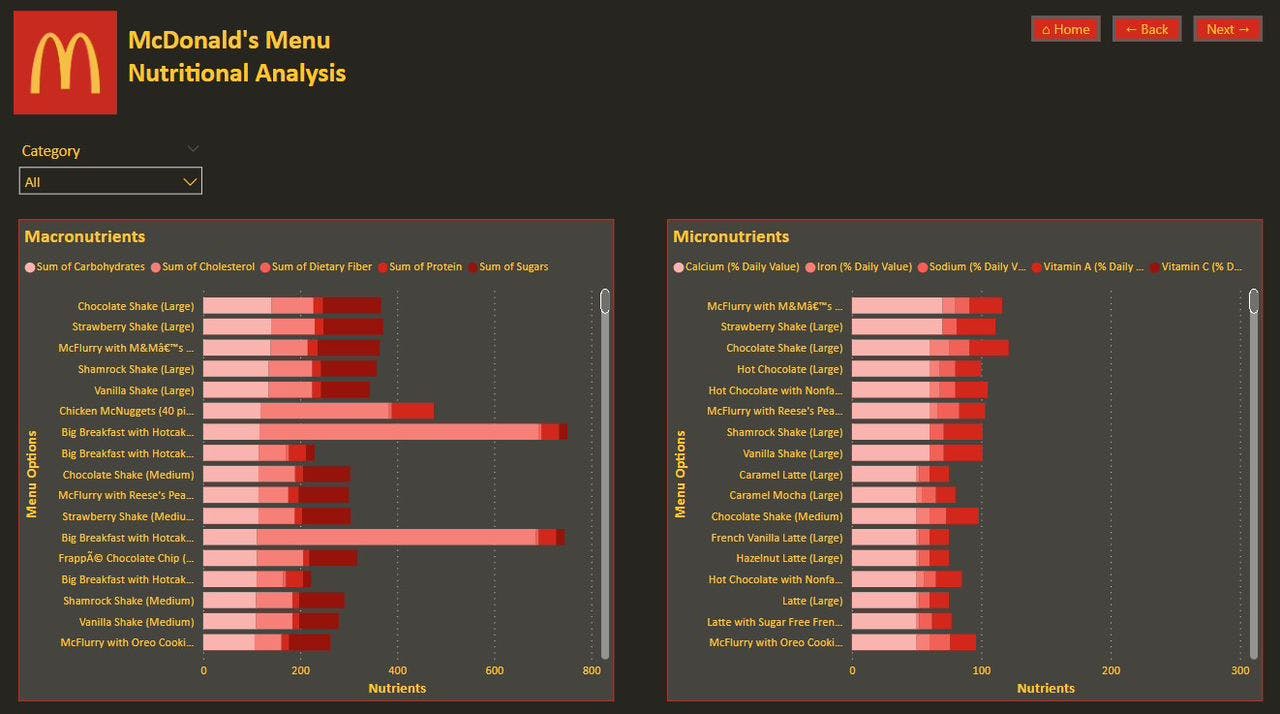
We categorized the nutrients into Macronutrients (Carbohydrates, Sugars, Fiber, Fat and Protein), and Micronutrients (Sodium, Calcium, Iron, Vitamin A, and Vitamin C) for each menu items with an option to filter based on menu categories:
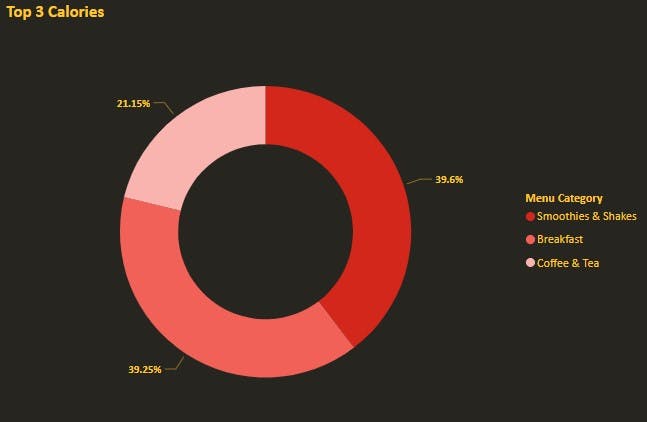
This Donut Chart shows the top 3 calorie distribution among the categories. Breakfaskfastis the highest among the top three categories containing39.25% with smothies & shakes following closely behind with 21.15%:
The table below shows the menu items and their serving sizes. This is necessary to paint a picture of the quantity of each item on the menu.

Recommendation and Conclusion
This analysis provides information on the number of calories and nutrients in each category and item. To eliminate bias in our category analysis, we calculated the average.
Based on our analysis, the smoothies category has a higher sugar content compared to the other categories. Consequently, consumers with diabetes might be unfit to consume from this category, therefore new products from this category should be designed specifically for them.
Furthermore, the cholesterol content in the breakfast category is enormous. As a result, this should be reconsidered to minimize cholesterol levels.
The menu should be inclusive of all populations while also keeping people's health in consideration.
Dashboard